Bioquímica cerebral
1H Magnetic Resonance Spectroscopy (MRS) assessment of the effects of Eicosapentaenoic-Docosahexaenoic Acids and Choline-Inositol supplementation on Children with Attention Deficit Hyperactivity Disorder (ADHD)
Results
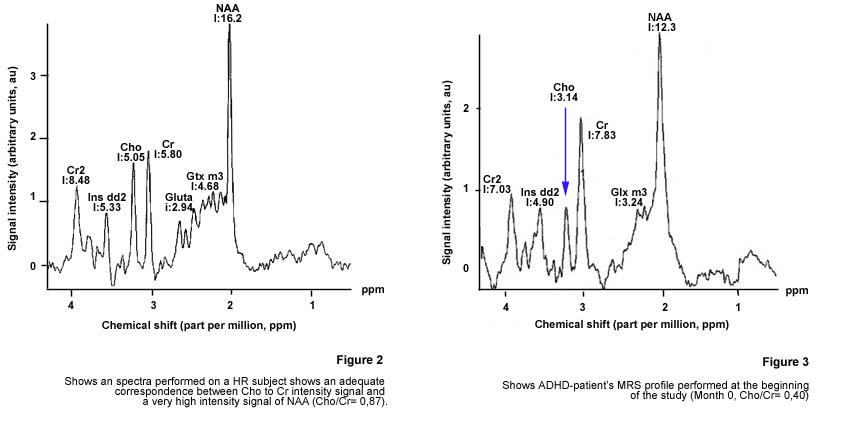
Figure 2
shows a MRS performed on a HR subject. The signals coming from NAA, Glx (Glx
m3), Gln (Gluta), Cr, Cho, mI and Cr2 are clearly defined.The Cho/Cr ratio are
0.88 considered into reference range for healthy people (0.75-1.25)
The sequence
of the results obtained on ADHD patient taking as a representative one are showing
in Figures 3,4 and 5.
Figure 3
shows MRS performed at the start of the study (Month 0). Note the absence of
the Gln signal and the low Cho/Cre ratio.
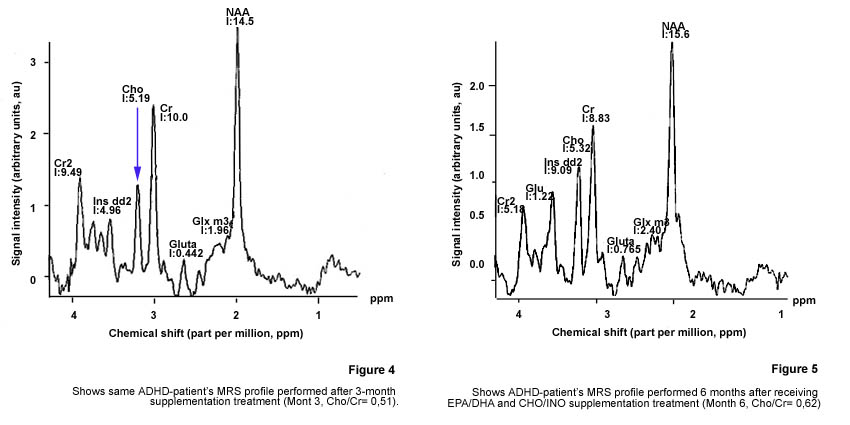
Figure 4
and Figure 5 represents MRS performed on Month 3 ant Month 6. In comparison
with Figure 3 (Month 0), we clarly note the progressive increase in Cho/Cr ratio
from 0.40 (Month 0) to 0.62 (Month 6) demostrating the feasibility of using
MRS in the assesment of the effects of EPA/DHA plus CHO/INO.
The results shown in Table 1 demonstrate that Cho/Cr ratio increased
in the Basal Ganglia on ADHD-children after 6-month EPA/DHA and CHO/INO supplementation.
The Cho/Cre ratio in both sides of Basal Ganglia was 15-16% higher in the second
MRS profile than in the first one. NAA/Cho+Cre and NAA/Cre ratios didn?t
show statistical differences when both studies were compared.
| |
NAA/Cho+Cre |
NAA/Cre |
Cho/Cre |
| Right
Basal Ganglia |
Month 0 |
0.84 ±
0.20 ns |
1.48 ±
0.33 ns |
0.79 ±
0.27 * |
| Month 6 * |
0.78 ± -0.25 |
1.57 ± 0.34 |
0. 94 ± 0.25 |
| Left
Basal Ganglia |
Month 0 |
0.79 ± 0.20
ns |
1.41 ± 0.37
ns |
0.80 ± 0.26
* |
| Month 6 * |
0.76 ± 0.24 |
1.52 ± 0.35 |
0.95 ± 0.24 |
Table
1
Means Metabolite ratios' comparison between two
studies performed on ADHD-patients
* p < 0.05. (ns = no significant difference) |